19 December 2005

Tim Hortons Spinoff


You may recall in a recent post on Joel Greenblatt's old book, "You Can Be A Stock Market Genius", that spinoff companies' returns beat the S&P 500 by a considerable margin. You also may remember that the parent companies beat the S&P as well.

At the time, I was excited to read news of McDonald's spinning off its winning Mexican chain, Chipotle. While that spin-off is in the works, investors are still pressuring MCD to sell off its corporate-owned stores and become more like a REIT.

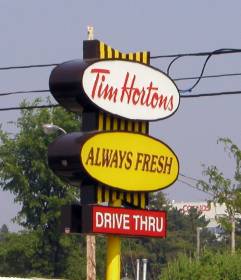
A few days ago, I read on Fark that Wendy's investors have successfully pressured my favorite fast-food establishment to spin off its own fast-growing chain, Tim Hortons.

Tim Hortons coffee chain in $600M IPO
Wendy's filing follows lobbying from hedge fund Pershing; burger chain retreats from '05 forecast.
December 2, 2005: 8:02 AM EST

NEW YORK (Reuters) - Wendy's International Inc. filed for a $600 million initial public offering of its Tim Hortons coffee shop chain Thursday and said it could not back its 2005 earnings forecast due to several one-time items, including a fourth-quarter charge for store closings.

Wendy's (Research), the No. 3 U.S. burger chain behind McDonald's Corp. (Research) and Burger King Corp., said it will take $79 million to $95 million in charges for closing some Wendy's, Baja Fresh and Tim Hortons restaurants as well as asset impairment.

The company is closing 40 to 45 Wendy's restaurants, five Tim Hortons and four Baja Fresh outlets.

A currency hedge is also expected to affect the company's fourth-quarter tax rate, and Wendy's said it was therefore unable to affirm its earnings outlook for the year.

Wendy's will record gains of $60 million to $70 million for selling about 200 of its hamburger restaurants to franchisees and third parties.

The company said in October it was expecting earnings of $2.12 to $2.15 per share.

Dublin, Ohio-based Wendy's has been struggling to reverse sluggish sales at its namesake restaurants for more than a year. In July, the company said it would spin off fast-growing Tim Hortons so it could focus on the battle of its flagship brand against a revitalized McDonald's.

The IPO move followed months of public lobbying by activist hedge fund Pershing Square Capital Management, which owns a stake in Wendy's exceeding 10 percent of its shares.

Bill Ackman, Pershing's principal, told Reuters he believed the Tim Hortons spinoff would do well.

"We're very impressed with the reported numbers for the business, we think it's a great company and we think there's going to be a glowing reception," he said at a seminar run by The Daily Deal newspaper in New York on Thursday.

He added that the Wendy's developments would be a boost to his campaign to have McDonald's spin off 65 percent of its company-owned restaurants in an IPO.

"This is a company that is not capitalized correctly," Ackman said, adding that McDonald's makes the lion's share of its money through real estate and franchising fees, not through food sales.

The expected price range and the number of shares to be offered in the Tim Hortons IPO have not been set. The offering will be underwritten by Goldman, Sachs & Co. and RBC Capital Markets, according to the filing with the Securities and Exchange Commission.

Tim Hortons intends to apply for New York and Toronto Stock Exchange listings under the symbol THI.


Tim Hortons is ubiquitous in Canada. The chain was founded by its namesake, the late Toronto Maple Leaf pictured to the left. Of the 2842 locations, 2564 are north of the border, with almost 1400 locations in Ontario alone. New Brunswick, a much smaller province, has 122 locations. Putting those numbers in perspective, there are 11.4M residents of Ontario and 730K residents of New Brunswick. So there is approximately one Tim Hortons in Ontario for every 8150 people. In New Brunswick, one location for every 6000 people.

There are almost twice as many Tim Hortons locations in Canada as there are McDonald's.

Growth in Canada? Hmm. I'm not lovin' it.

But how about right here in the United States? Out of the currrent 278 locations, 30 are in Rhode Island, while New York has 71 (though none in NYC) and 73 in Michigan. My calculations show that each Tim Hortons in RI serves 35K people, while in Michigan, it's one Tim Hortons per 135K people. New York, one for every 268K people. Now there is the opportunity for expansion.

Hints of the expansion plans are right there on the franchise section of the Tim Horton's website:

As of July 2005, there are over 260 Tim Hortons locations in the United States. These are situated in Michigan, Ohio, New York, West Virginia, Kentucky, Maine, Rhode Island, Connecticut, Massachusetts and Pennsylvania. Future expansion and opportunities will continue in these markets for the next several years.

...

Certain states regulate the offer and sale of franchises. We have not applied for registration (or exemption from registration) under the laws of Hawaii, Maryland, Nebraska, North Dakota, South Dakota, and Utah. If you are a resident of one of these states, we will not offer a franchise to you at this time.


We're looking at possible expansion in New England, parts of the Rust Belt, and into the South, while ignoring for now a bunch of thinly-populated states (save for Maryland).

I'm getting excited about maple-frosted donuts and coffee. And I may not have to wait 'til my next trip to Montreal to get some sweet satisfaction.

So should I wait for the THI offering, or buy into WEN right now? Or perhaps do both? Or should I continue to wait for the McDonald's spin-off of Chipotle?

Here are some quick comparison numbers from SmartMoney and Morningstar between WEN and MCD:

Net Profit: 1.40% vs. 11.80%
PEG: 2.10 vs. 2.04
Price/Sales: 1.70 vs. 2.20
Price/Cash Flow: 22.20 vs. 11.60
ROE: 2.90 vs. 16.60
ROA: 1.60 vs. 8.70
Morningstar Growth: B vs. B
Morningstar Profitability: B vs. B+
Morningstar Financial Health: A vs. A

WEN is near its 52-week high. The stock has done really well this year, even with its lagging fundamentals. I appreciate the hedge fund pressure to extract shareholder value. I cannot make a fundamental case for buying WEN. However, this activist-investor pressure, plus Greenblatt's point that parent companies beat market returns, is keeping me interested in WEN. I will keep abreast of the THI IPO as well.

I am also still very much interested in the McDonald's/Chipotle story. There could be some fast returns in fast food.

12 December 2005

Outsized Gains from a Value Investing Perspective - John Dorfman's Small Stocks

John Dorfman is a Bloomberg.com columnist with a value-investing perspective. He recently wrote a column on small stocks that fit his investing criteria. He says he likes small stocks because he has a better shot of finding a bargain amongs issues that are under the market cap necessary to get on Wall Street's radar.

A year earlier, he made seven picks that returned an average of 21 percent. Caught my attention right there. Dorfman backed up this claim with his list and results:

Here's the scorecard on last year's picks:

Gymboree Corp. (GYMB) was up 75 percent.

Perini Corp. (PCR) rose 57 percent.

Escala Group Inc. (ESCL), formerly Greg Manning Auctions Inc. (GMAI),
returned 50 percent.

United Fire & Casualty Co. (UFCS) gained 37 percent.

Metal Management Inc. (MTLM) inched up 5 percent.

America Service Group Inc. (ASGRE) dropped 24 percent.

Cal-Maine Foods Inc. (CALM) was the big loser, down 55 percent.


Quite a bit of volatility on that list. Six out of seven positions hit big or missed big.

This year's list are another seven companies with market caps below $1 billion. Here's Dorfman's picks with analysis. I will follow with my thoughts on his choices, plus some small-to-medium-sized alternatives.

We'll start with Deckers Outdoor Corp. (DECK) of Goleta, California.
The company designs and markets footwear, such as Teva sandals and Ugg
boots.

Deckers stock has fallen 48 percent this year. My firm sold the stock
short in late 2004 at about $46, betting that it would go down. We
covered our position in April at about $26.

Attractively Cheap

Now that Deckers is down to less than $25, I find it attractive. That
price works out to 11 times earnings, 1.9 times book value (assets
minus liabilities per share) and 1.2 times revenue.

Deckers has debt equal to only 8 percent of stockholders' equity, and
it earned a stellar return of 24 percent on equity last year.

Safety Insurance Group Inc. (SAFT) sells auto insurance and other
property-and-casualty insurance in Massachusetts. The Boston-based
company's stock has risen 37 percent this year, yet still appears
attractively cheap at eight times earnings and one times revenue.

Safety had a combined ratio (claims plus expenses, divided by premiums
collected) of 91 percent last year, which is considered very good in
the insurance industry.

Steel Bargain

Next up is Novamerican Steel Inc. (TONS), based in Dorval, Quebec. It
produces steel tubing and flat-rolled steel.

Like many U.S. steel stocks, Novamerican is cheap -- it sells for 8
times earnings, 1.5 times book value and 0.5 times revenue. Unlike
many U.S. steel stocks, Novamerican has a strong balance sheet, with
debt only about 19 percent of equity.

After posting big gains in 2003-2004, Novamerican stock is down 31
percent this year. I own call options on these shares for some of my
more venturesome clients.

Fourth, I recommend Gold Kist Inc. (GKIS), a chicken producer based in
Atlanta. Like other chicken stocks, it suffers from Avian flu fears.
The stock was down 12 percent in October and 7.4 percent in November.

Gold Kist has turned a profit in three of the past four years, and
seems cheap to me at six times earnings, 1.8 times book value and 0.3
times revenue.

Fifth, I suggest KHD Humboldt Wedag International Ltd. (KHDH) of Hong
Kong. Until Nov. 1, the company was known as MFC Bancorp Ltd., and was
based in Austria. I have recommended it from time to time and
currently own it for one client.

Metal, Telecom and Eggs

Previously a merchant bank, KHD now owns an aluminum rolling mill in
Germany, operates a cobalt refinery in Uganda, and has a metal-trading
operation, MFC Commodities GmbH. The stock sells for 10 times
earnings, 1.2 times book value and 0.4 times revenue.

Premier Global Services Inc. (PGI), out of Atlanta, provides
conference-call and other telecommunications services to companies.
The stock has fallen 26 percent this year, which looks to me like an
overreaction to a minor earnings shortfall in the third quarter.

Finally, I would like to try again with Cal-Maine Foods, the big loser
from last year's list. The Jackson, Mississippi, company owns about 22
million hens and produces about 13 percent of the eggs sold in the
U.S.

Profitability has been spotty, with losses in four of the past 11
years. The shares peaked near $22 in December 2003, when the Atkins
diet was riding high. They have fallen all the way to $6.31.

Now that the shares have cracked, they sell for only six times
earnings, 1.3 times book value and 0.4 times revenue -- the sorts of
ultra-cheap multiples I like.


Dorfman's first pick, DECK, seems like the worst pick. As I've blogged before, I am willfully fashion-ignorant. So when I've heard of Ugg boots, and know that they're passe, they could be as far gone as flannel shirts. Or acid-washed jeans. Maybe even as outmoded as parachute pants. I know so little of fashion that I can't even come up with good examples of stuff out-of-fashion. And I don't trust Dorfman to know this.

However, there have been a couple of recent articles at fool.com looking into DECK's woes. Salim Haji tried to put a value on DECK, taking into account the passing fads of Uggs and DECK stock:

What is Deckers worth?
To answer my questions, I thought about Deckers' intrinsic value. The
company has three primary brands -- Ugg, Teva, and Simple. According
to its most recent press release, the company expects net sales for
2005 to be about $154 million for Ugg, $85 million for Teva, and $8
million for Simple. In my mind, the only brand that has any real,
sustainable long-term value is the Teva brand. I see Ugg as a passing
fad with minimal staying power. With less than $10 million in sales
and no growth, Simple is too small to matter. That leaves the real
value of the company in Teva, which outdoor enthusiasts recognize as a
premier brand.

According to the company's 2004 10-K, Teva generates about $25 million
in cash flow on $88 million of sales, which are essentially flat. This
is a stable, healthy business that spins off significant cash. Roughly
speaking, we can value that brand at eight times cash flow (a typical
multiple for this kind of business), or about $200 million. To me,
this is what the brand would be worth to a competitor like Timberland
(NYSE: TBL) or Reebok (NYSE: RBK), companies that could simply roll
the business into their existing infrastructure. That figure would
also be close to what the brand would be worth to a private equity
firm, which could run Teva as a standalone business with minimal
corporate overhead.

Ugg is the key
To unlock this value, the strategy would be to milk the Ugg brand. In
2004, Ugg generated about $32 million in cash flow on just more than
$115 million in sales. Going forward, I would very conservatively
expect the brand to be able to generate at least that much as sales
drop off over a couple of years.

According to its 10-K, Deckers today spends about $20 million in
corporate overhead, and it is not allocated to any product line. This
amount is probably for executive salaries, corporate accountants,
corporate advertising and promotion, and a host of other costs to
support the three product lines. Most, if not all, of these
expenditures would not be required if a competitor or a private equity
firm bought Deckers and ran it as the Teva brand. However, shutting
down these corporate offices would require a one-time cash outlay for
restructuring costs.

When would Deckers become attractive?
So at what point does Deckers become attractive as a takeover
candidate for the Teva assets? If we make the simple and conservative
assumption that the cash generated from Ugg would be adequate to cover
required restructuring costs, and we ignore Simple because it is too
small to matter, the value of the company is about $200 million. If I
were doing the deal, I would want a solid margin of safety -- I would
start to become interested at $150 million, and my interest would grow
from there as the price fell. With about 12.5 million shares
outstanding and essentially no debt on the balance sheet, Deckers has
an equity value of about $12 a share, given the $150 million figure.
At anything below $10 per share, this company becomes a prime takeover
candidate.

Though the stock appears to have temporarily stabilized at around $18
per share, I'm watching this one closely. Three years ago, the stock
was trading below $5 per share. If it gets back down anywhere close to
that level, I may again take a position in Deckers. Mr. Market's
behavior opens up opportunities on both the long and short sides of a
stock. I've been successful with Deckers on the short side, and I'm
hoping an opportunity will soon arise on the long side.


DECK has risen quickly to near $30 a share since this piece appeared on November 18, 2005. That makes me sceptical of a buying opportunity here.

DECK also doesn't seem to gel with Dorfman's small-stock thesis. He says he is looking for stocks followed by fewer investors, but DECK is followed by plenty of analysts, sites like fool.com, and trades at significant volume on the NASDAQ.

Fashion is fickle by its nature. I think DECK's fundamental numbers reflect their pas success with Ugg.

SAFT seems an excellent small stock choice. According to its Morningstar Report, SAFT scores an A- for growth and an A for profitability. It's PEG is an enticing 0.5. SmartMoney says its net profit of 12.2% beats the competition, while its price/cash flow is a low 6.9, and its ROE an attractive 24.6%. Among competitors, only Mercury General (MCY) garnered higher Morningstar grades. MCY, with a market cap of $3.2B, would have been screened out under Dorfman's criteria. Either seem worth a further look.

TONS is definitely an under-the-radar pick that doesn't even warrant a mention in this series of recent fool.com articles on steel picks. The pieces focus on huge players, like Korea's largest manufacturer, POSCO (PKX) and the Netherlands' Mittal (MT). One smaller player they do like is Steel Dynamics (STLD). Morningstar likes it too, giving it a growth grade of A+, profitability grade of A, and financial health grade of B. Favorable numbers against the competition include a PEG of 0.64, price/cash flow of 4.5, 5-year earnings growth of 59.33%, and net profit of 10.3%. Again, STLD's market cap of $1.5B kept it just off of Dorfman's radar. All of these SmartMoney numbers surpass the available figures for TONS.

GKIS and CALM are two picks that fly in the face of avian flu fears. We've got both the chicken in GKIS, and the egg in CALM.

Lined up against its competition, GKIS makes top marks for net profit margin (4.80%), forward P/E (6.5), PEG (0.77), and ROE/ROA (32.10%/13.40%). So what's the problem here? GKIS laid an earnings egg last quarter:

GoldKist Gets the Kiss-Off

By Stephen D. Simpson, CFA
November 18, 2005

Having heard from the likes of Tyson Foods (NYSE: TSN) and Pilgrim's
Pride (NYSE: PPC), I think most investors already know the score in
the poultry world. Feed prices (a key cost input) are down, but
poultry pricing has fallen off as well. The latest pullet producer to
report, GoldKist (Nasdaq: GKIS), seems to have suffered a real clunker
of a quarter.

Sales were down 10% as reported, and even adjusting for the extra week
in the year-ago quarter renders a negative 3% result for this quarter.
While the company did manage to ship more pounds of poultry, the drop
in realized prices more than overwhelmed that. As you might suspect,
operating leverage cuts both ways, and profitability dropped along
with revenue. Operating margin worsened by a bit, and net income
dropped more than one-fourth from the year-ago level.

GoldKist management didn't seem to have a whole lot of new things to
say. Feed prices were lower, but forward contracts kept them from
realizing the full benefit. Poultry export demand is still very
strong, but more sluggish demand in the food-service chain hurt
domestic results. Remember, GoldKist has a good-sized private label
operation, selling to companies like Wal-Mart (NYSE: WMT), Albertsons
(NYSE: ABS), Wendy's (NYSE: WEN), and SYSCO (NYSE: SYY). If there's
really weakness in the demand channel, GoldKist definitely feels it.

What I don't understand is the apparent magnitude of the earnings miss
this quarter. According to what I see online and in print, the average
estimate for the quarter was $0.77, whereas the company reported
$0.49. Perhaps I'm missing something somewhere (like analysts using an
operating number instead of a net number), but boy, does that look
like an unusually large miss for this sort of business.

At the bottom line, this is another company with very little control
over its costs (feed and energy, for instance) or final pricing.
That's a tough foundation from which to build a sustainable
competitive advantage and long-term shareholder value. While the stock
looks pretty darn cheap on a P/E basis, I'd make certain that "E" part
won't get pecked away before putting any of my nest egg into this
stock.


CALM may have bottomed out. Dorfman picked it again after suffering a 55% drop, reflected in the F grade for growth by Morningstar. But the other grades aren't so bad; CALM gets a B- for profitability and an A for financial health. I think a contrarian play, against the bird-flu scare could be a profitable long-term play. And Dorfman seems genuinely excited about CALM's bargain-basement price. Can the price really get any worse...

*cough*

*cough*

We're left with KHDH and PGI.

KHDH has some SmartMoney numbers that make it stand out clearly from its competition: 5-year sales growth (51.00%), price/sales (0.30), price/cash flow (6.40), ROE/ROA (18.00%/7.80%). Seems very solid on this very cursory review.

PGI has some decent numbers among some less savory ones: price/sales (1.10), price/cash flow (6.50), ROE/ROA (19.10%/11.10%). Morningstar grades PGI a B for growth, a D for profitability, and a B- for financial health. Dorfman is not saying this is a wonderfully run company. In spite of missing earnings forecasts, PGI has grown sales and earnings very nicely since 2001, as well as upped its free cash flow from $18M in 2002 to $41M in 2003, from $58M in 2004 to $72M in the trailing twelve months.

Let's wrap up this never-ending post. I appreciate John Dorfman's picks, but I would make some changes, even going so far as to expand the criteria beyond the $1B limit. I'm going to keep tabs on a modified Dorfman small stock list that leaves off DECK, TONS, and GKIS.

The final list, with current price as I type this: SAFT ($43.70), MCY ($58.85), STLD ($34.94), KHDH ($21.75), PGI ($8.21), CALM ($6.80).

06 December 2005

What Was I Thinking?

Checking out another stock blog, uglychart.com, I did the unthinkable. I clicked on a Google ad, one that leered at me, offering a free newsletter of top 2006 stock picks. Curiousity got the best of me, so I used my spammy hotmail account to obtain a pdf file from NewsletterAdvisors.com.

I received a professionally-produced-seeming document featuring stock picks from a variety of subscriber-dependent stock newsletters. I had heard of the Gardners from Motley Fool, but the others were new to me.

The first pick, courtesy of Louis Navellier and his Blue Chip Growth Letter, is on the Pig Stock Watch List--Suncor Energy (SU).

Here is the second half of the report just for you, so you don't have to suffer the indignity of finding the report yourself:

Fundamentally, Suncor is probably the strongest oil company on my
current Buy List. It has incredibly healthy operating margins, and is
ready to handle the long-term energy boom.

It’s one of the largest producers of oil and natural gas in North
America.

The company recovers bitumen—a very heavy oil—from the oil
sands and refines it into useable products.

Suncor is a fully integrated energy company with a long, successful
history in the oil and natural gas businesses. In the second quarter of
this year, net earnings were $112 million, and cash flow from operations
was $305 million. The company has increased shareholders’
wealth 16-times over in the last ten years.

During the quarter, Suncor made significant progress in rebuilding
portions of the oil sands plant damaged by a January fire, and they
expect to return to full production capacity in the third quarter. Major
repairs are complete, and the remainder of the reconstruction
effort is now focused on replacing piping and
electrical systems to support operations.

Planned maintenance, which had been originally scheduled
for September, was brought ahead and was near completion
at the time of its last earnings announcement. Once that is
done, Suncor expects to commission new expansion projects at the oil
sands plant and increase production capacity by the end of the year.
Tar sands companies like Canadian Natural Resources and Suncor are
sensitive to oil prices. However, the oil they get out of the tar sands is
sweet. They use natural gas to generate a lot of steam to get the oil
out of the tar sands, extra-expensive sweet crude that’s in high
demand. These tar sands companies will be doing very well for a long
time. Yes, the cost of natural gas has gone up, but the margins
to extract the crude are still very fat.

We’ve already made a lot of money with Suncor (up 139%) and I
expect to make a lot more. We're still in the early stages of this oilsands
boom. The company will boost daily capacity to a half-million
barrels by adding their third plant. And overall, they expect to boost
output 50% by 2008. Buy it under $66.


SU is a pure play on the Alberta oil sands, and yet I've been hesitant after looking at some fundamental numbers. Comparing SU with other independent oil and gas companies at SmartMoney.com, SU has a lagging net profit margin, a price/cash flow ratio two to four times higher, and a forward P/E of 40. Take the forward P/E; two companies involved in the Canadian oil sands, Imperial Oil (IMO) and Murphy Oil (MUR) have forward P/E ratios of 16 and 13.

I wonder if oil sands optimism is already priced into SU? Or do the past numbers fail to reflect the huge potential for SU in Alberta as the biggest individual player? Is the best investment Suncor's growth, or in a more conservatively priced IMO?

If SU is using so much natural gas, is Canadian natural gas company Encana (ECA) worth a look?

Navellier mentions (not in the above excerpt) Chinese demand, and throws out a Goldman threat of $105 oil before begging off. But these arguments favor investing in oil stocks in general, not specifically in SU.

Navellier says: "Fundamentally, Suncor is probably the strongest oil company on my current Buy List." The lawyer in me is suspicious. Parsing this sentence, "probably the strongest" is flimsy support. The reader gets no further information as to the other oil stocks on Navellier's buy list. And where are the numbers, the evidence of Suncor's strong fundamentals? He cites net earnings and cash flow in a vacuum, without context. Remaining numbers mentioned in the piece: SU's return to shareholders over the last ten years (16-times!), and Navellier's personal gains (139%!).

Fine, I'm analyzing an internet sales pitch for a fee-based newsletter. The Wizard of Oz springs to mind, where there's just an old man behind the curtain using a booming microphone and flashy lights to fool me into thinking he has the answers.

I'm not convinced. I still don't know which oil play to make.

SU - Pro: Pure oil sands play plus growth potential. Con: Growth priced into its outsized P/E.
IMO - Pro: Tremendous free cash flow and oil sands exposure. Con: High PEG.

Or maybe an indie oil and gas producer like XTO or Apache (APA) - Pro: PEG below 1.0, net profit margins and ROE significantly higher than SU and IMO. Con: No oil sands exposure.

Navellier's Blue Chip Growth Letter and its ilk, as well as top stock lists, can be informative, and spur ideas. Lately they've provided some nice blog fodder. But at least for me, this stuff raises more questions than provides investible answers.

02 December 2005

Is it time to gamble on WPTE?


Is it time to gamble on WPTE...and hedge that move with HET? Or should I forget poker tours entirely and invest in a true value and cash play, IGT?

Is WPTE priced as a value play? It's certainly near its nadir for several reasons that fool.com's Jeff Hwang discusses below:

WPT: Worth more than zero?
I tend to think of myself as being mostly indifferent with regard to WPT Enterprises (Nasdaq: WPTE), the company behind the World Poker Tour television show. But the stock has been in a freefall since Doyle Brunson's supposed takeover bid pushed the stock up to a high at $29.50 this past summer. And watching the stock hit a new low yesterday at $6.15, I just can't help but think that the stock has got to be worth more than zero.

It's Harrah's World Series of Poker vs. the World Poker Tour all the way around. But WPT is hardly alone in this battle -- its business partners have a stake in its success, as well. Really, it's Harrah's vs. everybody else on the casino front, including rival MGM Mirage, which hosts several WPT events at Borgata, The Mirage, and Bellagio. And on the slot machine front, it's International Game Technology's (NYSE: IGT) WPT slots vs. WMS' upcoming series of WSOP slot machines. On the video game poker front, it's Take-Two's WPT vs. Activision's WSOP-branded game.

In addition, WPT Online -- the company's new online gaming site and the key to the stock's upside -- now has IGT as a business partner, with the latter company's recent acquisition of WPT Online partner Wager Works.

And don't let WPT's past couple of quarterly earnings (or lack thereof) fool you: There's a legitimately profitable business here.

Last week, the company posted a wider-than-expected third-quarter loss of $1.6 million, or $0.08 per share, vs. the analyst expectation for a loss of $0.05 per share. The company also forecast light on fourth-quarter revenues, as its guidance of $4.5 million to $5 million in revenues was well short of the $8.5 million analyst estimate at the time.

WPT has taken a shot in the foot in a dispute over its Professional Poker Tour series with the Travel Channel (see WPT's PPT Saga ), which airs the WPT show. As we discussed back in September, WPT had already shot its first season of the PPT and recorded expenses for the episodes, but negotiations for the series broke down between the two parties. And apparently, WPT had a three-year deal in place with Disney's ESPN for the PPT. At that point, the Travel Channel stepped in and interfered with the deal by threatening a lawsuit. WPT countered by filing suit itself against the Travel Channel back in September.

But as a result, WPT now doesn't expect to derive domestic license revenues from the PPT in the fourth quarter. Instead, the PPT will air internationally and be used as advertising for WPT Online. Still, product licensing revenues were up 481% to $930,000 in the quarter. WPT Online generated $175,000 in revenues its debut quarter, and with marketing spending picking up, is expected to do $225,000 to $275,000 in revenues in the current fourth quarter.

And despite its shortcomings, analysts still expect the company to earn $0.39 per share next year.


While WPTE is an incredibly risky investment, I think the following problems are already priced into the stock:

Amateurish WPTE business moves driving the Professional Poker Tour from the TV to the courtroom.

The Doyle Brunson-rumored takeover fiasco over the summer that pushed the stock from $20 to $30, and back down to $20 and lower over the course of a few days.

The lull between WPT television seasons is in full swing as reruns of last season are rerun again. I have to get my tv poker fix by catching the competition, like the highlight-driven WSOP events on ESPN, or watching C-listers playing D-list quality poker on Bravo's Celebrity Poker Showdown. And then there's the poker programming on FSN, so commercial-heavy that it's unwatchable without using an ad-skipping DVR or TiVo.

A not-so-brief aside: As a viewer of the World Poker Tour, I've noticed that Travel Channel has been re-running old episodes for quite a while. Where are the new episodes? Upcoming season 4 has 16 tournaments, which means 16 episodes, 16 weeks of fresh poker. That leaves 36 weeks a year of replays as well as forcing me to suffer through some of the crap offerings on the Travel Channel. Food Network couldn't handle the piss and vinegar of Kitchen Confidential author Anthony Bourdain. Travel Channel runs his show, yet it has the Rachael Ray-patina of cheeze dripping all over, with Bourdain stretching to fill an hour program with his increasingly hammy schtick. Mark DeCarlo (I think he hosted Studs from way back in my high school days) has a crap-o-rama called Taste of America. In a Nashville segment, he mocked the Loveless Cafe owner with the tired old gag about Southerners having two first names. His host abruptly disappeared, dumping DeCarlo onto his African-American biscuit maker. Bad enough that DeCarlo sheepishly pointed out to the viewer that he was rude to his host. Things degraded further when he started talking biscuits. Sure enough, he started to ease the lilt of his voice to approximate a southern black patois.

Okay, so this train wreck was entertaining, if unintentionally so. The Travel Channel needs both WPT and PPT programming. The PPT whould fill in some of those 36 weeks of reruns, while providing higher-rated, and higher-quality entertainment than what is currently on offer.

Other issues I have with WPTE may not be priced in at $7+:

- WPT is facing fierce competition in the online poker area. WPT advertisers like FullTiltPoker.net, PokerStars, and PartyPoker are the players. WPT does not have much of an online presence in the States, and operates its internet gambling business in the UK, where it's legal. This may be a good thing, as I think various state AG's may start cracking down on internet gambling at off-shore poker sites.

- WPT established itself as the premier league/circuit for poker, likening it to a sports league like the NBA. But now it looks more like the ABA, or the NHL, after Harrah's bought the World Series of Poker. HET expanded the brand beyond a few tourneys at Binyon's Horseshoe. The WSOP now includes satellite and feeder tournaments. As everyone knows, it's aired (constantly) on ESPN, far from the digital cable ghetto where Travel Channel lies. Hwang has a point that it behooves HET's competitors to support the WPT, but do I want to invest in the dominant player, or an also-ran?

Is the poker business maturing to the point where there could be some consolidation? Could a stronger player, say one of the websites that advertises on WPT, decide to buy out the WPTE stock, not at the crazy Brunson premium, but at a premium to the current trading price? I don't want to buy a stock hoping for a takeover. Talk about a longshot gamble.

What about a safer bet? Pat Dorsey's short piece with the elegantly alliterative title, 5-Star Stocks that Spit Out Cash, cut through the stock picking bullshit in asking two questions: "Is it a decent business, and is it reasonably priced?" Among his picks, WershovenistPig Stock Watch List resident, IGT:

International Game Technology IGT
Cash Return: 6.2%
Price/Cash Flow Ratio: 12
Economic Moat: Wide
Business Risk: Average

From the Analyst Report: "We continue to believe that IGT has excellent long-term prospects. Investors willing to look beyond the near-term sluggishness will, in our view, find that the market's shortsightedness has created a compelling buying opportunity."

30 November 2005

Parsing 5 Cheap Stocks from Forbes.com

Last night, the Kirk Report offered up a quick link to Forbes.com, offering up five under-$10 stocks that may not belong in the bargain basement. (Note that I have cleaned up the excerpt for ease of reading):

Are these five stocks hidden gems?

It's not unusual for investors to shun stocks priced under ten bucks,
which in the minds of some suggests poor quality. But these five
companies, all profitable over the past 12 months, have posted
five-year sales growth of more than 5% (annualized), while analysts
expect their earnings to advance at a 10%--or better--clip for the
next three to five years. In addition, all these stocks show trailing
12-month price-to-earnings multiples below their five-year averages.
...
Bell Microproducts (nasdaq: BELM)
Cholestech (nasdaq: CTEC)
CyberSource (nasdaq: CYBS)
Encore Medical (nasdaq: ENMC)
Southern Community Financial (nasdaq: SCMF)


First off, I ran each of these tickers through CNBC's Stock Scouter. Each rated either a 3, 4, or 5, so dismal to merely mediocre.

Next, I checked each ticker on SmartMoney.com's competitive analysis screen to check out each company's numbers, and those of some of their competitors. This process quickly weeded out SCMF from further consideration, as numerous statistics lagged its competition, including its net profit margin, PEG, price/cash flow, and ROE/ROA/ROIC.

So let's do a quick run-through of the remaining four stock ideas.

ENMC is an Austin, Texas-based designer and manufacturer of orthopedic devices. Check out their site for some impressive graphics of implantable devices for the knee, hip, shoulder, and spine. If you click on the link, you can actually make a game out of trying to figure out which futuristic device is surgically inserted into which part of the body. But if you're too lazy to do that, here's the image below. The spine is the easiest to pick out.


ENMC trades at around $5.40, about 25% off its 52-week high. Attractive numbers from SmartMoney.com include its PEG, at .94, a Price/Cash Flow of 9.40, and 5-yr Sales Growth of 53.28%. However, ENMC's Net Profit Margin is a low 3.40% and its ROE is 4.80%.

Free cash flow, from Morningstar, has been positive and significant since 2001, with a hiccup in 2004: '01 6.1; '02 8.1; '03 8.1; '04 (5.5); TTM 10.3.

CTEC makes and markets diagnostic products that help assess the risk of heart disease, diabetes and certain liver diseases outside hospitals and laboratories. Its numbers aren't so lovely: Price/Cash Flow is 15.30, ROE is 10%, 5-yr Sales Growth is 9.52% and Net Profit Margin is 11.10%. The CEO, Warren E. Pinckert, has been selling shares: over 19K in October, 20K in September, and 12K in August.

Free cash flow has been mixed since 2000, but positive in the last year: '00 3.6; '01 (1.9); '02 3.6; '03 0.8; '04 (4.6); '05 7.1; TTM 9.3.

These mediocre-at-best numbers plus the significant insider selling makes me profoundly uncomfortable with continuing with CTEC.

BELM is hard to describe in one sententce, so here's what I pilfered off of their website:

BELM...is an international, value-added provider of a wide range of high-technology products, solutions, and services to the industrial and commercial markets. The Company's offering includes semiconductors, computer platforms, peripherals, and storage products of various types including desktop, high-end computer and storage subsystems, fibre channel connectivity products, RAID, NAS and SAN storage systems and back-up products. Bell Microproducts is an industry-recognized specialist in storage products and is one of the world's largest storage-centric value-added distributors.

SmartMoney calls BELM an electronics wholesaler. Its numbers shine against the industry competition, garnering top marks in 5-yr Sales Growth of 11.55%, a PEG of .89, and Price/Cash Flow of 11.00. Its ROE/ROA of 6.90%/1.80% lag, as have the stock's returns to investors over the last twelve months and three years.

Free cash flow has been mixed since 2000, and it plummeted in the last year: '00 (70.8); '01 24.2; '02 15.2; '03 (45.5); '04 15.1; TTM (47.6).

Finally, we have CYBS, which provides online commerce transaction processing services. Very sexy. This company trades at around $7.50 and has a market cap of around $250M. Its PEG, of 1.46 is not that attractive on its own, but compares nicely within the business software and services sector. The Net Profit Margin of 14.60% is solid, with a ROE/ROA of 13.90%/12.00%.

Free cash flow may look ugly, but the numbers have moved in the right direction year after year: '00 (60.3); '01 (30.1); '02 (8.6); '03 (5.0); '04 0.9; TTM 1.7.

I think we're left with three stocks worthy of more investigation. I guess the lesson for me here is top 5 or top 10 lists are neat little packages for magazines to publish. Some would say these lists are a crutch for the editorially lazy and uncreative. In fact, I say it. Why do you think I'm blogging about a top 5 list? I'm using a news crutch for a blog crutch. How meta.

Anyway, the real lesson: These lists can contain some crap. This one sure does. I know it's just a short piece based on a simple stock screen. Once the stock screen filters out the obvious garbage, it is then up to the Pig to sniff out the subtler refuse.

When it's time to start the portfolio, I'll revisit ENMC, BELM, and CYBS.

29 November 2005

Lifecell (LIFC)

Upon a rare visit to one of the Hudson News locations in Grand Central, I picked up Monday's IBD. Why the Monday edition, after the long Thanksgiving holiday weekend? Certainly not for the IBD editorial page that eschews nuance and makes publications like the WSJ and Weekly Standard seem downright pink (and I'm not talking paper; the FT has dibs on that.) My first motivation for grabbing the IBD was for its proprietary ratings system and the IBD 100, a list of top stocks according to its evaluative methodology. Secondly, I am trying to whittle down the list of oil stocks on the WershovenistPig Stock Watch List to a couple of top investible choices.

Paging through IBD, I found a nifty table of ten "Market-Leading Medical Stocks". When my wife stumps me with health questions, I am quite fond of replying cheerily, "Lawyer, I'm a loy-yer. Not a doctor. Ask me questions if you get sued." Because I am a good husband, I then check WebMD or the Mayo Clinic website to get answers. I say this because I am quite ignorant of the medical profession and the attendant companies that work within it. So it goes without saying that I appreciate IBD finding and presenting potentially attractive medical stocks. But I said it, or wrote it, so I guess it goes with saying.


Number 6 on the list is Lifecell Corp (LIFC), the developer of AlloDerm, a human skin grafting product and process.


This Branchburg, New Jersey-based biotech firm has some quality IBD ratings:

SmartSelect Composite Rating - 97
Earnings Per Share Rating - 99
Relative Strength Rating - 94
Sales+Profit Margins+ROE Rating - B

These figures caught my eye, as well as LIFC priced at over 20% off its 52-week high.

Next I checked out the LIFC competition over at SmartMoney.com. What I found is LIFC is a small company, with a market cap of around $620M, and earnings of $12M on revenues of $84M. SmartMoney offered up companies like Amgen ($100B market cap), Gilead Sciences ($24B market cap), and Genentech ($100B market cap)for comparison's sake. Still, LIFC has solid comparable figures, as well as the lowest PEG of the group, at 1.33.

The free cash flow story from Morningstar is telling, as LIFC first generated positive FCF only in 2002, and has climbed nicely in the last two years:
'96 (4.2); '97 (6.1); '98 (8.7); '99 (14.0); '00 (13.5); '01 (2.2); '02 1.9; '03 (1.7); '04 5.6; TTM 11.1

So why is the stock significantly off its 52-week highs?

This is a small company and a volatile growth stock where bad news, even of a minor variety, can significantly affect earnings and the share price.

Last month, the AP reported that LifeCell received problematic tissue from one of its suppliers, prompting a recall:

FDA Warns About Unscreened Human Tissue; N.J. Company Under Investigation

WASHINGTON (AP) -- The Food and Drug Administration said Wednesday it is investigating a New Jersey-based company that sold human tissue to processors for eventual implantation into people because it may not have been properly screened for infections.

The New York Daily News reported earlier this month that the district attorney's office in Brooklyn, N.Y., is investigating the company, Biomedical Tissue Services of Fort Lee, N.J., on allegations the firm illegally bought body parts from funeral homes to sell to tissue processors. An FDA spokeswoman would not comment on those allegations.


The recall affected LifeCell's earnings, which came in lower than analysts' optimistic expectations:

LifeCell (LIFC:Nasdaq - commentary - research - Cramer's Take) dropped 10% after the company lowered its 2005 earnings guidance. The company, which develops products made from human tissue for use in surgical procedures, reported third-quarter earnings of $2.5 million, or 7 cents a share, on sales of $24.5 million. Results were hurt by a pretax charge related to the write-off of $1.4 million in inventory and by a $469,000 reserve for product returns related to a recall. Analysts expected earnings of 10 cents a share, with sales of $24.4 million. A year ago, the company earned $1.1 million, or 3 cents a share, on sales of $15.6 million.

For the full year, LifeCell now expects earnings of $11.7 million to $12.3 million, or 35 cents to 36 cents a share. Previously, the company projected it would earn $12.1 million to $13.3 million, or 37 cents to 40 cents a share. The company narrowed its sales projection to $92 million to $94 million from $90 million to $94 million. Analysts had forecast earnings of 39 cents a share and sales of $93.1 million. Shares were trading down $1.92 to $17.03.


This price dip could be a good opportunity to get into LIFC. LIFC is good enough for the IBD, and after this bit of due diligence, it's certainly good enough to get added to the WershovenistPig Stock Watch List.

28 November 2005

Creme Eggs and Licorice Ropes


As candy goes, I love the buttercreamy fondant center of Creme Eggs, and could live without the taste of licorice in my candy. As stocks go, figuring out whether or not I want to invest in the makers of these confections is more complicated than taste.

Jim Cramer started me down the winding Candy Land path of this post. From the 11/22/05 recap of Mad Money:

Beverage and confectionery company, Cadbury Schweppes (CSG:NYSE - news - research - Cramer's Take), announced Monday that it would sell its European beverage business, and analysts applauded, said Cramer.

He believes that Cadbury can take a hint and will sell its American beverage business, which includes Dr. Pepper, 7 Up, and Schweppes.

Cramer said candy is growing faster than soft drinks, and Cadbury's P/E multiple is being held down because of the beverage business. Cadbury trades at about 16 times earnings, said Cramer, while pure-play candy companies such as Hershey (HSY:NYSE - news - research - Cramer's Take) and William Wrigley Jr. (WWY:NYSE - news - research - Cramer's Take) sell at 23 and 28 times, respectively.


Cramer's enticing thesis is that investors will profit if Cadbury spins off its soda business and focuses on making Creme Eggs, Caramellos, and other gooey chocolate confections. Wall Street rewards growth, and would reward CSG for sloughing off its slower growth soda business. His "addiction by subtraction" thesis reminded me of my recent Greenblatt readings about spinoffs. I like this kind of counterintuitive thinking.

Taking Cramer's numbers and fleshing them out, CSG is trading at around $39 a share, with earnings per share of around $2.45, giving an approximate P/E ratio of 16. Doing some very simple arithmetic manipulation, if CSG's P/E ratio were to rise to between 23 and 28, where HSY and WWY trade, shares of CSG would trade at between $56 and $68, an increase of 44% to 74%. This is a lucrative thesis, indeed. But a thesis riding on a huge contingency:

Cadbury's multiple is sure to expand, if it sells off its American beverage business, he said.

Management has been coy about its plans, though, said Cramer. So, if it becomes apparent Cadbury isn't going to sell, the investment thesis is void, and you should get out the stock.


CSG is not such an attractive stock to own in its current form. Looking at numbers from SmartMoney.com, CSG has a PEG of 2.26. The stock has appreciated 11% in the last year and 60% over the last three, leaving CSG's current share price a bit rich when you look at its competitors in the soft drink industry. Coke (KO) and Pepsi (PEP) both have lower PEGs (2.09 and 2.02, respectively).


Among CSG's confectioners competitors is the second stock for today, an obscure producer of licorice flavorings that grabbed my attention with impressive 5-year earnings growth and net profit margin numbers, M & F Worldwide (MFW).

Here is the company's website, a simple affair that explains the diverse array of industries and products that utilize licorice flavoring. MFW even proclaims itself "The World Leader in Quality Licorice Products Since 1850" from the very, um, humble locale of Camden, New Jersey.


MFW has a profitable niche to itself. Forget commodities like precious metals and oil, MFW is minting money out of licorice root. Here are some more attractive numbers from Morningstar:

Free cash flow has been fairly steady, and impressive for a company with a market cap of $325M:
'96: 8.0M; '97: 23.0M; '98: 30.2M; '99: 26.9M; '00: 29.5M; '01: 65.3M; '02: 36.5M; '03: 33.4M; '04: 22.2M; TTM: 30.1M

MFW has a low Price/Cash Flow ratio (10.3) compared to other stocks in its industry (12.0) and the S&P 500 (14.4). Morningstar says that this low ratio can signify a good value if the cash flows are sustainable or can grow. Using the FCF history of MFW as a guide, cash flow looks solidly dependable.

MFW is about 40% above its 52-week low, and just 5% off its 52-week high. The Short Interest is 11.7, meaning there are a lot of shorted shares of MFW. SmartMoney says that "A short interest ratio of greater than 2.0 is often considered a sign that a stock's price will soon go higher. The rationale is that the large short position must be covered in the future, thereby creating buying pressure and driving the stock price up."

But not all of the numbers are cotton candy and lollipops. Earnings are down slightly from last year:

Basic earnings per common share were $0.32 in the 2005 quarter and $0.34 per common share in the 2004 quarter.

No earnings growth, no PEG.

There's also this odd bit of company diversification reported in the November 9 press release:

On October 31, 2005, the Company announced that it entered into a Stock Purchase Agreement, dated as of October 31, 2005, with Honeywell International, Inc., pursuant to which the Company will acquire all of the issued and outstanding shares of Novar USA Inc. for a purchase price of $800 million. Novar USA, Inc. is the parent company of the businesses operated by Clarke American and related companies, including Alcott Routon, Checks in the Mail and B2Direct. Clarke American provides check-related products and extensive servicing to financial institution customers. Alcott Routon provides direct marketing programs based on analytics and predictive modeling to help financial institutions target customers. Checks in the Mail supplies checks and other financial documents directly to consumers, and B2Direct offers customized business kits and treasury management services to businesses.

The company acquired an unrelated check printing business with their piles of ducats. The synergistic possibilities here elude me.

So we have some negatives to contend with:
1. Negative earnings growth;
2. Licorice business tied to the tobacco business which may be growing abroad, but is stalled here; and
3. Paying bills online should be hurting the check printing firms, right?

Candy is a sweet and tasty treat. It also can make you hyperactive. Candy can put a smile on your face, or contribute to unsightly tooth decay. Not to mention a flabby middle. I'm really stretching this metaphor, but these pros and cons, risks and rewards, are reflected in CSG and MFW. These stocks have been sweet to their investors, but is the flavor about to run out?

22 November 2005

Battle Royale - NASDAQ Winners

This is the battle of NASDAQ 52-week highs (from last week) that I promised in the first Battle Royale post. Let's begin, without any Michael Buffer-style announcements.

Comparisons may be difficult to make with these apples and oranges, so I'm throwing out some extra numbers for your edification.

AZPN

Numbers from SmartMoney.com: PEG 2.94, ROE/ROA/ROIC 343.96%/-23.46%/363.72%, Total Debt/Equity -.03
Free cash flow numbers from Morningstar.com: '00 - 18.3; '01 - (33.7); '02 - (21.0); '03 - 16.8; '04 - 37.3; '05 - 20.7
CNBC Stock Scouter Score: 10

Profile excerpts from Yahoo! Finance:
Aspen Technology, Inc. and its subsidiaries supply software and services to the oil and gas, petroleum, chemicals, pharmaceutical, and other industries that manufacture and produce products from a chemical process. The company develops software to design, operate, manage, and optimize its customers’ key business processes, including plant and process design, economic evaluation, production, production planning and scheduling, and managing operational performance.

I appreciate that AZPN is no start-up clamoring for quality clients. Check out this bit of immodesty from AZPN's website:

AspenTech boasts a client list that includes some of the major names in the process industries, including:

23 of the top 25 petroleum companies
47 of the top 50 chemical companies
19 of the top 20 pharmaceutical companies
16 of the top 20, and all of the top five, engineering, procurement & construction companies


AZPN could be an interesting derivative Fort McMoney oil play.

I'm having real trouble gathering quality information that would explain AZPN's sudden increase in share price. Some IBD and technical analysis-types are paying attention, as AZPN's trading volume is up along with the price, at its resistance level. Here is a pretty graph that back up my brief ignorant foray into the world of technical analysis.

I need a shower after that.

AZPN is interesting, with some decent, erratic positive free cash flow. The PEG is high, and the there's some debt, two negatives. I'd like to learn more about this one.

LVLT

Numbers from SmartMoney.com: PEG N/A, ROE/ROA/ROIC 148.57%/-7.29%/-10.58%, Total Debt/Equity -9.63
Free cash flow numbers from Morningstar.com: '00 - (4944.0); '01 - (2184.0); '02 - (645.0); '03 - (167.0); '04 - (352.0); TTM - (368.0)
CNBC Stock Scouter Score: 6

Profile excerpts from Yahoo! Finance:
Level 3 Communications, Inc. provides communications and information services worldwide. It offers softswitch services, including managed modem for the dial-up access business, wholesale voice-over-IP (VoIP) component services, and consumer oriented VoIP services; Internet protocol and data services, such as Internet protocol transit and network interconnection solutions; and transport and infrastructure services that include high-speed Internet access services, wavelengths, and dark fiber services.

LVLT's debt load is astounding, and presumably correlates to their significant negative free cash flow. Analysts predict increasingly negative earnings over 2006. VoIP is a technology full of potential. Growth investors gravitate to trendy tech, but the cool factor only hastens my retreat from this stock.

Stephen D. Simpson at Fool.com sends LVLT to the showers in these excerpts:

There were also some encouraging words behind the numbers. Prices are declining more slowly, and demand is still firm. Of course, the capacity problem remains -- demand for network capacity is strong and growing, but there's still a glut of available capacity. Services like broadband Internet and voice over Internet protocol should take up more and more of this surplus, but that's going to take years.

No doubt Level 3 has good technology and customers -- including the likes of SBC (NYSE: SBC), Time Warner (NYSE: TWX), Microsoft (Nasdaq: MSFT), Comcast (Nasdaq: CMCSA), and Verizon (NYSE: VZ) -- but it's also got $6 billion in debt. Unlike the cable or cell phone companies of the '80s and '90s, Level 3 can't assume that its large initial losses will be offset by concurrent revenue growth and potential monopoly power.
...
Anyone who holds these shares today is likely a trader or speculator. That, or they have a great deal of faith in the idea that all of Level 3's built-out capacity will turn into real profits and shareholder value. Since I neither speculate in stocks nor invest on faith, I'll be staying well away from these shares.


RNWK

Numbers from SmartMoney.com: PEG .20, ROE/ROA/ROIC 4.06%/2.57%/3.23%, Total Debt/Equity .26
Free cash flow numbers from Morningstar.com: '00 - 32.0; '01 - 2.6; '02 - (7.1); '03 - (17.9); '04 - (3.0); TTM - 0.7
CNBC Stock Scouter Score: 7

Profile excerpts from Yahoo! Finance:
RealNetworks, Inc. provides network-delivered digital media content and services worldwide. It also develops and markets software products and services that enable the creation, distribution, and consumption of digital media. The company primarily offers its products under two categories, Consumer Products and Services (CPS), and Business Products and Services (BPS). The CPS category offers digital music products and services, including Rhapsody, an ondemand digital music subscription service; RadioPass, an Internet radio subscription service; and the RealPlayer Music Store, which enables consumers to purchase and download individual digital music tracks.

Fool.com delivers more useful insight into RNWK:

Investors keep buying into different versions of RealNetworks (Nasdaq: RNWK). Some have invested on the heels of its settlement with Microsoft (Nasdaq: MSFT), which will fatten its already cash-stocked balance sheet. Others have bought into RealNetworks for its popular Rhapsody digital music subscription program, which continues to gain new listeners. Still others are buying into RealNetworks for the lucrative deals it brokers with wireless giants. Last night, as it does every three months, the company revealed the sum of those parts in its latest earnings statement.

RealNetworks posted earnings of $0.06 a share on a 20% spurt in revenues. The profit reversed a year-ago loss, though the company has been in the black for all three quarters of 2005. The current quarter will be a winner, thanks to Microsoft's nine-figure apology. RealNetworks will earn between $1.42 and $1.48 per share for the period. Obviously, though, that will be a one-time boost -- don't even try to incorporate those lofty sums into the company's earnings multiples.

Rhapsody's subscriber base has doubled over the past year to 1.3 million users. Yes, this is a competitive niche. Even though RealNetworks was a pioneer in digital music, it has to compete against the likes of Napster (Nasdaq: NAPS) and Yahoo! (Nasdaq: YHOO) in music subscription services, as well as Apple (Nasdaq: AAPL) and Microsoft when it comes to paid downloads.

Given its 184 million diluted shares outstanding, I'd really like to see RealNetworks use some of its balance sheet greenery to buy back even more shares. As strong as RealNetworks may appear to be, its earnings are getting watered down among all that stock. Unless RealNetworks is planning to buy out Napster or make any other synergistic acquisition, it's not likely to need all the money that's collecting cobwebs in its coffers.


Good to hear complaints about a company having too much cash. (I know, companies like MSFT and XOM have too much cash, and it becomes increasingly difficult to find ways to get a good investment return on that cash hoard, etc. etc.)

I wonder if that sexy PEG is a result of the MSFT settlement figured into earnings?

GROW

Numbers from SmartMoney.com: PEG N/A, ROE/ROA/ROIC 15.35%/13.18%/15.35%, Total Debt/Equity 0
Free cash flow numbers from Morningstar.com: '00 - 1.0; '01 - (0.1); '02 - 0; '03 - 0.1; '04 - 2.5; '05 - 0.9; TTM - 0.9
CNBC Stock Scouter Score: 6

Profile from Yahoo! Finance:
U.S. Global Investors, Inc. through its wholly owned subsidiaries, provides mutual fund management services. It provides investment advisory services to institutions and individuals; transfer agency and record keeping services; mailing services; and distribution services to mutual funds advised by the company. The company primarily invests in early-stage or start-up businesses. U.S. Global Investors was founded in 1968 and is headquartered in San Antonio, Texas.

GROW sells 13 different mutual funds, several of which earn four and five-star ratings from Morningstar. This is a small purveyor of funds. So will GROW grow?

IBD gives GROW an overall score of 81, or a B. The S&P report reads in a similar B-grade, somewhat positive fashion. But the folks at Yahoo!, teaming up with IBD, have this stock at #3 on a top under-$10 stocks list.

This battle is too close to call between AZPN, RNWK and GROW. I would appreciate any readers comments on this one.

Battle Royale - NASDAQ Losers for November 21

This sad array of tickers appeared on the NASDAQ 52-week low list yesterday:

ARDM, BANFP, BARI, CIPHE, DYII, FBMI, HAST, MDCA, MCCC, NTEC, PCOP, PLUG, POTP, SYMC, YBTVA

They're mostly unfamiliar to me, too. I weeded out the sub-dollar stocks, as well as the issues with narrow 52-week trading ranges, namely a couple of local banks. I noticed some stocks that appeared on the list last week. I left those free-fallers off. That left:

CIPHE, DYII, HAST, MDCA, MCCC, NTEC, PLUG, POTP, SYMC, YBTVA

Quickly scanned the Key Statistics page at SmartMoney.com for each of the above to see if any had positive signs, or were profitable, so I wouldn't waste more time than I needed to on obvious duds.

And then there were three: DYII, HAST, and SYMC.

It's time for battle. Allez cuisine!

DYII - Dynacq Healthcare - Down $0.35 to $2.80. 52-week range: $2.81-$5.60

Here's what DYII does, as explained on their website:

Dynacq focuses on efficient, high-volume specialty surgical hospitals and ambulatory surgery centers to provide excellent healthcare for our patients. Our facilities specialize in a small number of higher-margin specialties and procedures – orthopedics, neurosurgery and general surgery.

DYII operates these surgery centers in Pasadena, West Houston, and Dallas, Texas, as well as in Baton Rouge, Louisiana. They are working on a joint venture project in China.

The Dynacq website is pitching pretty hard to surgeons, a refreshing relief from small companies who often seem desperate to woo investors on their websites. Dynacq plays up their business' benefits to surgeons: increased efficiency, numbers of procedures performed, and of course, income.

Why did the stock hit a 52-week low? Dynacq's press release for its 2005 fiscal year results explains:

HOUSTON--(BUSINESS WIRE)--Nov. 16, 2005--Dynacq Healthcare, Inc. (NASDAQ Capital Market:DYII) announced audited financial results for the fiscal year ended August 31, 2005. For the fiscal year ended August 31, 2005, net patient revenue decreased by $7,574,517 or 12% from $62,849,378 in fiscal 2004 to $55,274,861 in fiscal 2005 primarily due to declines in both net patient service revenue and patient procedures at the Pasadena, West Houston and Baton Rouge Facilities. Net loss increased by $3,528,674 from a net loss of $1,608,260 in fiscal 2004 to a net loss of $5,136,934 in fiscal 2005.

Dynacq's business declined at three of its four locations. And Dynacq is more unprofitable in 2005, than in 2004, with a net loss increase of 219%.

I don't know how this weak contender slipped into the competition. I can't find anything positive on their Key Statistics data sheet.

HAST - Hastings Entertainment - Down $0.54 to $4.96. 52-week range: $5.05-$9.99
Fool.com just posted a negative review of Hastings yesterday. I've included it here with some edits for clarity:

Hastings Wasted

By Nathan Slaughter
November 21, 2005

With Thanksgiving fast approaching, retailers far and wide are anxiously awaiting Black Friday, the start of the frenzied holiday shopping season. Cooler weather, enticing promotions, parking lots crammed with early bird shoppers ... it's an ideal time for a struggling company like Hastings (Nasdaq: HAST) to lift its sluggish sales out of the doldrums.

However, I seem to recall having a similar amount of optimism this time last year -- misplaced optimism, as it turned out. The one-stop shopping specialist has struggled ths year, and those hoping it might gain some traction heading into the critical fourth quarter will be disappointed. Yesterday, the company announced that third-quarter losses widened from $0.14 to $0.24 year over year, while revenues that slipped 4.2% to $114.6 million.

The company's game and movie rental operations continue to deteriorate, faced with competition from online sources like Netflix (Nasdaq: NFLX) and consumers' increasing preference to buy films rather than rent them. For the quarter, rental revenues dropped 10% to $21 million. Unfortunately, the merchandise segment wasn't able to bail the company out this time, as comps for music, books, and video sales all showed a decline. Even the traditionally strong video game department registered a disappointing 9.4% same-store sales drop, though last year's impressive 51% gain made for difficult year-over-year comparisons.

After hearing the news, investors headed quickly for the exits. The stock tumbled 12% to a new 52-week low below the $5 mark. The sharp pullback has made these cheap shares even cheaper:

Industry Average vs. HAST
Price/Sales - 0.1 vs. 4.9
Price/Book - 0.7 vs. 5.0
Price/Cash Flow - 1.0 vs. 25.1
PEG - 0.8 vs. 1.0
EV/EBITDA - 3.5 vs. N/A

The format in Hastings' 150 superstores is a bit unconventional. Video game and movie rental sections share space with trade-in counters for used CDs and movies, along with sections for new books, software, DVDs, cassette tapes, stereo equipment, and greeting cards. Look hard enough, and you might even find a Ted Nugent eight-track tape tucked away somewhere.

While the stores are a convenient place to shop, their recent numbers have been less than encouraging. On the positive side, Hastings managed to expand its gross margins more than 200 basis points during the seasonally weak third quarter, and the lone analyst who tracks the company has pegged its long-term growth rate at a respectable 10%.

Still, until the higher-margin rental side of the business shows signs of leveling off and merchandise comps return to positive territory, even Hastings' compelling price tag may not make it worth buying.


I buy completely into the conventional wisdom that the brick-and-mortar media retail business model is a terrible investment. When I think of buying CD's, which is getting rarer these days, I buy online, or go to a specialty store like Other Music. DVD's come from DeepDiscountDVD.com and Amazon.com. If I were to rent DVD's, I would use Netflix. If I were stuck living near a Hastings, I doubt I would feel compelled to shop there. And I don't think I'm out-of-the-ordinary here.

However, HAST has some cheap numbers. Its Price/Sales, Price/Book, and Price/Cash Flow ratios are are very low. Its PEG is 1.01. HAST is profitable, but not very, with a Net Margin of 0.90%. ROE/ROA/ROIC is 5.50%/1.93%/3.59%, also lower than its competition. The Fool.com writer is spot-on that this is an mediocre company with an unfocused, unconventional business model in an unappealing sector. That's why the stock is cheap.

SYMC - Symantec Corp. - Down $0.47 to $17.96. 52-week range: $18.01-$34.05

I wrote a short description of SYMC, but then I found a surprisingly well-done overview and recommendation of the stock:

With innovative technology solutions and services, Symantec helps individuals and enterprises protect and manage their digital assets. Symantec provides a wide range of solutions, including enterprise and consumer security, data management, application and infrastructure management, security management, storage and service management, and response and managed security services.

Symantec is the world leader in providing solutions to help individuals and enterprises assure the security, availability and integrity of their information.

Symantec's recently completed merger with Veritas leaves no doubt: Symantec is the best security software company in the world. The announcement of the Veritas merger started a prolonged decline in Symantec shares that I believe culminated earlier this month when the company lowered its revenue guidance and announced the resignation of its CFO.

At this point, I believe all the bad news is priced into the stock. Yes, Symantec lowered its 2006 revenue forecast but is still projecting $5 billion of sales in the coming year, has minimal debt, more than $4 in cash per share on the books, and cash flow above $840 million in the past 12 months.

I would be a buyer right here in the $19.50 range. If you are a trader and like to book short-term profits, I would sell at the 21-day moving average of $21.69.

Because this company is so undervalued, I would set a stop-loss just above the 52-week low of $18.01. If it goes back to that area, I would buy more.


Y'know who wrote the above piece? Former Phillies centerfielder, Lenny Dykstra.

Why is SYMC down? A slew of analysts downgraded the stock this past month. Bear Stearns initiated coverage with an underperform call.

How about some numbers? PEG of 1.07. ROE/ROA/ROIC of 3.50%/2.51%/3.50%. Net profit margin of 7.30%. SYMC's numbers are lower than its competitors, Internet Security Systems (ISSX) and VeriSign (VRSN). For the PEG, that's good. For the others, not so much.

Lenny's poised for a SYMC comeback. It's certainly the winner of this battle royale, but noting the strength of this field of competitors, it's not much of a victory.

21 November 2005

NASDAQ Big Movers Battle Royale - First Up, The Losers

You caught me rummaging through the daily lists of NASDAQ 52-week highs and lows.

If you click on one of the sidebar links to NASDAQ's daily tally of 52-week highs and lows for the three major American exchanges, you'll see that it can be a random walk around success (new highs list) or daily Sisyphean failure (stocks appearing a few times a week on the new low list). It's also a list of logos (NASDAQ-only), from the colorful and eyecatching, to the black-and-white descriptive. These lists offer an opportunity to explore companies and stocks that are outside of my interests, and on the margins of the business media's radar. The only criteria on making this list is stock performance.

For this exercise, I immediately filtered out any stock trading below $1 on the new low list. For the new-high list, I left out any stock that's trading much above $10 since I'm also trying to dig up more obscure stocks.

I plugged each ticker into the Key Financials page at SmartMoney.com. I'm generally looking for some sort of profitability, maybe some decent ROE/ROA/ROIC numbers, even a favorable PEG ratio. I entered 25 tickers. Most did not survive initial scrutiny. Maybe that's for the best, because the ones that did will be put through potentially humiliating analysis, stripped naked and prodded, all to see if we can find a stock worthy of inclusion in the oh-so-exclusive Stock Watch List.

Here are the candidates:

First off, from the November 18, 2005 NASDAQ 52-week lows (boo!)

ECGI
MATK
PDCO
SAFM
TARO

And from the NASDAQ 52-week highs (*clap* *clap*)

AZPN
LVLT
RNWK
GROW

I'll review the four winning stocks in an upcoming post, but here they are if any reader cares to comment on them ahead of time.

First, let's deal with the losers, battle royale style. Last stock standing gets a coveted spot on the Pig stock watch list, where the ticker will appear daily, for all Pig readers to appreciate. (I'm going with Iron Chef-style rewards for victory: the respect of one's peers and glory in victory, but no cash or a showcase of prizes.) The others will soon be forgotten in the unvisited archives of the blogosphere. Oh what a damning fate.

First up Envoy Communications Group, Inc. (ECGI) operates Watt International, an advertising consultancy specializing in private label products. What does that mean? They help create, design, and market the no name store branded products you get at stores like Wal-Mart and Safeway. Watt International designed President's Choice-branded foods sold at supermarkets across the United States. They currently work on Wal-Mart's home and garden product line. Previously, Watt consulted on Home Depot store layouts and signage, and designed the CTV news studio, which should mean something if you're Canadian, I guess.

ECGI also operates Parker Williams Design, based in the UK. However, that company's website is currently being re-designed. Hmm, very reassuring.

ECGI just hit a 52-week low, dropping $0.17 to $1.54 per share. A negative 2006 outlook press release probably triggered the drop. Check it out:

Preliminary comment on fiscal 2005 results and 2006 outlook
- PR Newswire
TORONTO, Nov 18, 2005 /PRNewswire-FirstCall via COMTEX/ -- Envoy Communications Group Inc.'s (Envoy) preliminary information indicates that results for fiscal 2005 will substantially meet previously announced earnings guidance of $.28 per share. Fiscal 2005 results will be released in December after approval by Envoy's Board of Directors.

Looking forward, Envoy believes that there are a number of economic uncertainties, competitive challenges and business risks that will impact the client spending commitments of its operating companies. As previously announced with its third quarter results, Envoy is experiencing price pressure on its roll out production services in both the UK and North America. Envoy has recently taken certain efficiency related initiatives, including outsourcing programs to lower cost centres and concluding strategic alliances and joint venture arrangements with business partners in new geographic markets.

As a result of these initiatives, Envoy's Board of Directors has approved the immediate implementation of a restructuring plan. Accordingly, Envoy will incur a restructuring charge of approximately $1.6 million in the first quarter of the current fiscal year. The annual savings in salaries, benefits and other expenses associated with this restructuring is approximately $3.7 million. Management believes that, by implementing the restructuring plan now, Envoy will be better positioned to remain profitable, if its clients' historical spending patterns do not materialize in the short term. At the same time, management will be pro-active in implementing other initiatives to achieve organic sales growth, reduce operating expenses and improve efficiencies.

Envoy has strengthened its strategic and creative services, which has resulted in Envoy winning significant consultation assignments with several of the largest retailers in North America. Although the company will continue to provide world-class production roll-out services, it will increase its pursuit of strategic assignments, as such assignments have the potential to increase Envoy's profit margins in the future.


ECGI is apparently buying back its stock. It is authorized by the NASDAQ and TSX to buy back up to 400K shares per month. As of June 30, 2005, there were 21.6M shares outstanding, giving the company a market cap of about $33M.

According to SmartMoney.com, ECGI has a ROE/ROA/ROIC of 3.83%/3.35%/3.82%. The company is profitable, but ever so slightly. Free cash flow numbers from Morningstar.com were erratic:
'00 (2.8); '01 10.6; '02 (14.4); '03 2.8; '04 (2.3); TTM (2.3)

Martek Biosciences Corporation, MATK, was down $0.60 to $26.37, well off its 52-week high of $70.50. From the MarketWatch.com profile:

The Group's principal activities are to develop, manufacture and sell products derived from microalgae. These products include specialty, nutritional oils for infant formula; nutritional supplements and food ingredients to promote mental and cardiovascular health; fluorescent markers for diagnostics, rapid miniaturized screening and gene and protein detection. The Group also develops new fluorescent detection products from microalgae that connect fluorescent algal proteins to antibodies. The trademarks of the Group include Neuromins (r), DHA Gold (r), DHASCO (r), and ARASCO (r).

Yummy yummy microalgae. MATK is down as analyst earnings expectations for '06 have been lowered recently. However, MATK has an attractive PEG of .98. Its ROE/ROA/ROIC is 10.80%/8.35%/9.18%. Negative free cash flow has been the tune for MATK for each of the last ten years.

PDCO, Patterson Companies, a distributor of dental, veterinary and rehabilitation products, fell $7.19 to $35.01. Dow Jones reported on the 18th that PDCO lowered its second-quarter earnings expectations to 32 cents a share, down from 35 to 37 cents. It also lowered its 2006 profit forecasts from $1.54 - $1.58 a share, to $1.44 - $1.46. PDCO has a PEG of 1.26, and an ROE/ROA/ROIC of 18.88%/10.91%/13.86%. The free cash flow is consistently positive, although lower in the TTM:
'00 52.5; '01 70.1; '02 79.4; '03 75.4; '04 178.1; '05 175.8; TTM 131.3

A quick perusal of news releases on TheStreet.com showed that PDCO is getting sued by a bunch of shareholder-class-action plaintiff's firms over missed earnings in March 2005 and alleged SEC violations. This type of litigation getting pretty typical these days when earnings surprises occur, so it's important to note the potential litigation costs, but not to worry too much. The bigger worry is PDCO's continued inability to meet Wall Street expectations.

SAFM, Sanderson Farms, Inc. produces, processes, markets and distributes fresh and frozen chicken and other prepared food items. The stock was down $1.10 to $31.70. Its ROE/ROA/ROIC of 21.56%/16.62%/20.89% compare very favorably to its competitors' numbers, namely Tyson Foods, Smithfield Foods, and Hormel Foods. SAFM's free cash flow has been positive and healthy, except for TTM, which is (7.5).

SmartMoney.com noted SAFM on September 28 as an appetizing takeover target:

In addition to being oil country, the Gulf Coast states affected by Katrina are also part of chicken country. Mississippi alone accounts for 9% of U.S. chicken production. Sanderson Farms (SAFM: 31.70, -1.10, -3.4%), headquartered in Laurel, Miss., had a bit more exposure to the storm than some of its competitors. About two-thirds of its capacity is in Louisiana and Mississippi. Fortunately, none of the chicken processors fared too badly. Sanderson says it lost about $3 million worth of chickens and $1 million worth of meat ready for export, and that the hurricane didn't have any long-term impact on operations.

Last year Sanderson sold 1.5 billion pounds of chicken, collecting $1.05 billion in annual sales, or about 20% more than it made in 2003. Conditions were ripe as poultry prices had climbed about 17% year-over-year. Since then prices have dipped slightly, and Sanderson's stock chart has flattened. Sales are expected to decrease this year to $1.01 billion and to increase to $1.14 billion next year.

Shares slid about 8% on Aug. 23, when the company released its fiscal third-quarter financial results. Sales fell 10% on a 6% decline in whole chicken prices and a 41% drop in boneless breast meat prices. Profits plunged 29% to $24 million. Per-share profits of $1.19 missed analysts' expectations by 13 cents. Included in the earnings were seven cents per share in start-up costs for a new processing plant in Georgia.

Despite the earnings shortfall — and partly because of the stock's fall — there's much to like about Sanderson right now. Industry watchers say that it's the most efficient chicken processor in the business. Its gross margin of 16.9%, vs. 13% for Pilgrim's Pride and 6.7% for Tyson, supports that claim. We've written in the past about how chicken processors are trying to mix more "value added" chicken products (preseasoned entrées and so forth) into their sales in an effort to boost margins. Sanderson seems to have taken the opposite tack, embracing the fresh chicken business that its competitors are lightening up on. Its new facility in Georgia will increase its capacity for tray-packed fresh chicken by 40%. Analysts say the company is shaping up to be the country's low-cost producer of fresh chicken.

Short-term cost fluctuations aside, analysts say that chicken pricing is more or less stable at the moment, and that the outlook is favorable. Domestic production is growing at about 3% to 4% a year. Domestic consumption is increasing at 2%, but exports are expanding at 10%. Sanderson's export sales accounted for just 6% of its overall revenue pie last year, suggesting that the company has room for growth.

Shares of Sanderson trade now at about 10 times the forecast for 2005 earnings, lower than an average of 12 for the group as a whole. With negligible debt and about $50 million in net cash on the books, the company's EV/Ebitda ratio stands at just under four. The average for meat processors is seven. Add to that a 1.1% dividend yield and Sanderson shares at their current price look plenty appetizing.


The last stock is Taro Parmaceutical. TARO. Its low PEG of .37 drew my attention. Then I saw its low ROE/ROA/ROIC numbers (5.51%/2.96%/4.89%) as compared to its competition. I then found the following bit of terrible news from TheStreet.com:

Shares of Taro Pharmaceutical (TARO:Nasdaq - commentary - research - Cramer's Take) were among the worst-performing health-related stocks Thursday, tumbling 33% after the company posted third-quarter results that fell well below Wall Street expectations.

The drugmaker earned $2.1 million, or 7 cents a share, on sales of $72.5 million. Analysts polled by Thomson First Call expected earnings of 28 cents a share, with sales of $80.7 million. During last year's third quarter, the company earned $4 million, or 14 cents a share, on sales of $73.3 million. "Our results reflect the competitive nature of the generic drug industry and our continuing investment in the development of proprietary and generic drugs," the company said. Shares were trading down $7.12 to $14.78.


The Pig is pleased that Sanderson is a poultry processor, and stays away from the pork. I'm also pleased to add SAFM to the Stock Watch List as the first winner of the NASDAQ Big Movers Battle Royale.

Do you think I made the right call? Did I find a pearl among swine, or did I just polish a turd?

18 November 2005

Why Men Should Be Involved in Wedding Planning


While digging up research on Jones Soda, I noticed TheKnot.com (KNOT) pop up along with it, as a small stock to watch. I vaguely recall the site from the days and months before my wedding.

Apparently, I should have paid more attention to TheKnot(and to wedding planning, as well). Investors have paid attention, and paid increasingly more for shares over the course of 2005.

Rick Aristotle Munarriz at fool.com called attention to KNOT twice this year, on March 10 and June 22. Here are the knotworthy excerpts from each date:

TheKnot.com (OTC BB: KNOT): $6.10. While it's easy to spot the flaw in the wedding resource site's plan -- it's an attractive draw for brides-to-be and nervous grooms-in-waiting for just a sliver of time -- what a great time to have someone's attention. With an audience that's young and ready to spend a ton of money, it's easy to see why online advertising rose by 41% for TheKnot.com last year. It turned a modest profit of $0.06 per share, and I like what I see in the company's recent moves to grow its audience beyond the current 1 million active members.

TheNest.com is the company's new site for newlyweds. It's an underserved and lucrative niche. The company also acquired a pair of dating sites a few months ago. Put together, you have a dynamic company that is now reaching out earlier in the courtship cycle, while also extending its grasp to the other side of "I do."

The Knot (Nasdaq: KNOT): $6.70
If you've ever walked down the aisle in the name of matrimony, you've probably had plenty of practice by the time you formally say, "I do." It's often a question the bride and groom ask themselves in the planning process. You need bridesmaids' dresses? "I do?" You'll need a DJ lined up for your reception? "I do?" That's where The Knot comes in. For those tying the titular knot, TheKnot.com is a resource for all those wedding details. The Knot has a killer brand that has been featured in various television outlets -- including a key role in the second season of "The Apprentice," when The Knot saved the day for one team.

It seems that the young and underprepared have been relying on The Knot -- the company's online advertising revenue rose by 41% last year. It's profitable, too.

However, what I most like about the company is how it has just started to capitalize on its strong position in drawing prospective newlyweds and broadening its wingspan. The company recently launched TheNest.com, designed to be a site for the newlyweds it helped get hitched in the first place. It also acquired a pair of dating sites, giving the company an even earlier hand in the courting process.


Since these pieces ran, TheKnot.com announced in September that it was teaming up with Zale Corporation, owner of Zales Jewelers, Gordon's Jewelers and Bailey Banks & Biddle. Together, they will cross-promote and cross-market each others brands.

I hope you ignored the outdated price quotes in the fool.com excerpts; KNOT currently trades for around $11.40 as I write this. So are we too late to the (wedding) party?

I think so. Let's look at some more numbers to make sure.

Free cash flow figures from Morningstar.com show much improvement. Between 1999 and 2002, KNOT had negative FCF, but I'm not surprised to see that in an internet start-up. In '03, KNOT had $3.1 in positive free cash flow. It dropped to zero in '04, but the trailing twelve months have seen a rebound to $3.0M. These are positive, but small numbers.

SmartMoney.com has some larger numbers that we need to consider. PEG is 1.31, so KNOT is no longer the bargain of six months ago. The P/E, a metric I don't bandy about much, is a lofty 102, based on a market cap of $255M. This should be unsurprising in a speculative growth stock.

Roughly half of all marriages end in divorce--we should wait and see if investors split up with their KNOT holdings, and then take another look.

17 November 2005

Watching the Watch List

It's time to check in and see what's going on over on the WershovenistPig Stock Watch List. Behind the scenes on this blog, I looked up historical closing prices on Yahoo! Finance for each stock on the List for the day it was added to the List, and for November 16, 2005. I also looked up just about every other stock I have mentioned on the blog, the closing prices the day prior to mention, and the closing price for yesterday, as well.

Much of the data is boring (and depressing, considering how crummy October was for the markets), so I'm keeping most of it to myself. But not all of it:

Best Performers on the Watch List
ATYT + 43.9%
ARXT + 33.4%
CTRN + 20.9%

Worst Performers on the Watch List
DWRI - 50.3%
MRH - 26.5%
SNAK - 21.1%

Best Left off of the Watch List
WPTE - 22.0%
ECA - 21.6%

Wish It Were on the Watch List
SIRI + 22.9%
COST + 19.0%

How are the individual groupings of stocks on the Watch List doing? Overall, pretty crappy, I'd say. But that's why it's a Watch List, and not the WershovenistPig Portfolio; the barrier to entry is much lower. By the way, the aforementioned WershovenistPig Portfolio is coming soon. There, I will put my money where my mouth is (a discretionary portfolio where my blog is?), by blogging my moves before and after I make them.

Well, shall we get back to scrutinizing the Watch List?

For the individual groupings, I weighted each stock equally, using the closing price of the date I added the stock to the List as the initial price.

Fort McMoney -9.0%
Other Energy -4.6%
Discount Shopping Thesis +5.6%
Trendy Shopping -9.8%
Casinos and Poker -4.8%
Security -0.5%
Buybacks=Greenbacks Basket +2.3%
Cheap Media (Not Bulk Blank CD-R's) -2.4%
The Doghouse +0.8%
Other Stocks at the Trough +3.1%

Four groups in the black; six groups in the red. Dividing out the Canadian oil sands stocks from the other energy stocks created the losing record.

16 November 2005

"I cannot finish a bottle, I just can't." - Jones Soda (JSDA)


That's a quote from the Jones Soda CEO, Peter van Stolk. If you look carefully at the label to the left, you'll see it's a bottle of smoked salmon soda (as opposed to regular salmon soda, and diet salmon soda with Splenda).

I think this is hilarious. It's also a brilliant bit of marketing that gets people talking, and apparently, blogging about a company. A funny CEO? A cool company? Hmm.

Fark.com brought the
salmon soda story
to my attention:

Bottler offers salmon-flavoured soda
Tue Nov 15, 2005 12:38 AM GMT

SEATTLE (Reuters) - For beverage connoisseurs tired of turkey-and-gravy or green-beans-and-casserole flavoured sodas, there's a new choice being offered this year by speciality U.S. soda maker Jones Soda Co.: salmon.

Jones Soda, the Seattle company that scored a hit during the last two holiday seasons with its turkey and gravy-flavoured sodas, said it is offering the orange-hued fish-flavoured drink this year in a nod to the Pacific Northwest's salmon catch.

"When you smell it, it's got that smoked salmon aroma," said Peter van Stolk, chief executive of Jones Soda.

The salmon-flavoured soda will be offered as part of a $13 "regional holiday pack" that also includes other unusual sodas such as turkey & gravy, corn on the cob, broccoli casserole and pecan pie.

While those five bottles will be offered locally, Jones Soda is also selling its similarly-priced "holiday pack" of turkey and gravy, wild herb stuffing, brussel sprouts, cranberry and pumpkin pie sodas across the country.

Thanksgiving, a U.S. holiday that falls on the fourth Thursday of November, typically features a dinner with turkey, gravy and other condiments.

Van Stolk, who built his Seattle-based soda company by selling traditional sodas as well as exotic flavours such as green apple, bubblegum and crushed melon, said that "the most important thing (about Jones Soda) is that we can laugh at ourselves."

Asked whether he liked his new salmon soda, van Stolk said: "I cannot finish a bottle, I just can't."


You know who is selling this holiday pack across the country? The cool kid of discount retailers, Target. I learned this from trudging through the comments section on Fark. Cramer also
positively noted
the JSDA/TGT connection back on August 25:

Is Jones Soda (JSDA:OTC BB - news - research - Cramer's Take) going places?

-- Dennis from Detroit

James J. Cramer: This is one speculative stock that I believe has solid potential. The company is expanding its footprint through Target (TGT:NYSE - news - research - Cramer's Take) and Starbucks (SBUX:Nasdaq - news - research - Cramer's Take). It will be some time until they're competing with Coca-Cola (KO:NYSE - news - research - Cramer's Take) and PepsiCo (PEP:NYSE - news - research - Cramer's Take), but I believe there is still plenty of room for Jones to grow.


But here's Mr. Consistency himself just two weeks before, on August 8:

What is your take on Jones Soda (JSDA:OTC BB - news - research)?

-- Jay from Tulsa, Okla.

James J. Cramer: Jones Soda has a deal with Starbucks and Target, but its high cost of growth is taking a toll on the bottom line. I like the long-term trends, but until I see this beverage play improve its operating execution, I would rather own Pepsi (PEP:NYSE - news - research).


Cramer's hedging his bets, as he should, since JSDA is a risky speculative stock trading under ten dollars OTC.

So I turned to a value investing blog I've recently discovered, called
Cheap Stocks. And to give credit where it's due, Cheap Stocks' editor, Clyde Milton, and his uncharacteristic analysis of JSDA, prompted me to write this post. Let's look at most of the details:

A Growth Stock? Out of my element…Lessons learned..and more

Jones Soda Co
Ticker: JSDA
Price: $4.88
Market Cap: $105 million
Shares Out: 21.4 million
P/E Ratio: you don’t want to know
2004 Revenue: $27.54 million
2004 Net Income: $1.33million

This is not the typical company we research here at Cheap Stocks. We are not oriented toward growth stocks; we wish were, but we just are not wired that way. We gravitate toward deep value plays, and Jones is far from deep value. So why dedicate valuable Cheap Stocks real estate toward a company trading at more than 100X earnings? Because this company reminds us our greatest investing mistake, Hansen(Ticker: HANS, $67.39).
...
Jones Soda Co sells it sodas (under the Jones Soda Co. and Jones Naturals labels), teas and energy drinks in 41 states, and Canada. You may have seen there distinctive looking bottles sold in supermarkets, at premium prices (in my eyes, anyway) and other stores, these feature interesting flavors, and ever changing labels, submitted by consumers. The company has also made a name for itself at Thanksgiving, selling a soda assortment that includes such flavors as turkey and gravy, and mashed potato (no joke, check it out on their website). I’ve also noticed a growing presence in Target Stores, where Jones sells 12 packs at somewhat inexpensive prices. Inroads into a major chain such as Target make this an intriguing story.

The Fundamentals
It ain’t cheap. There’s no other way to say it. At about 140 times trailing 12 month EPS, 2.8 times sales, and 19 times book value, this company should not be within 10 feet of the words “Cheap Stocks”. But, however, we at Cheap Stocks are warming up to the idea of paying up for rapid growth in certain cases, and this company may fit the bill…..We have to at least be open to the possibility

Jones 2004 fiscal year sales were $27.45 million, up nearly 37 percent from 2003’s $20.1 million. Net income was $1.33 million in 2004, for a net profit margin of 4.8 percent, up from 2003’s $324 thousand, and 1.6 percent. Through the third quarter of 2005, net sales are $32.4 million, up sharply $21.1 million for the same period last year. Earnings, however, are down, $720,000 for the first three quarters of 2005, versus $1.245 million for the same period in 2004.

The company does not have much to speak of in the way of assets ($9.7 million in total assets, $303 thousand in cash) nor does it carry much debt either ($116 thousand in LT debt). This explains the high price to book ratio, but also the company’s very high returns on capital and equity (more than 60% for each).

The Risks
Trading at such high multiples (to nearly everything imaginable) it appears that there is a great deal of growth priced into the stock. Still, trading below $5, the stock well off it’s high of about $8. While we are impressed by the company’s exposure in Target, we believe that the agreement expires in 2006, and are not aware of renewal prospects. Finally, the beverage market is extremely competitive, shelf space is difficult to secure, and margins are typically low.

Conclusion
While we don’t currently own Jones, we’ll be following the story, and perhaps looking for an entry point. A continued presence in Target, continued innovation in flavors and packaging, and growing brand recognition would all be pluses for this company. We’d imagine a great deal of price volatility moving forward. Finally, it is conceivable that ultimately, a bigger player takes Jones out.


Note the boldfaced quote. Milton is acknowledging that investing with a single philosophy has its (financial) shortcomings. I worry that he is regretting his unrealized Hansen gains, and trying to make up for it by backing another longshot in the soda business. But I appreciate his rigorous analysis that evaluates the negatives and the risks.

Fool.com weighed in with some insight back in September. Some excerpts:

You see, caramel apple soda is a staple in every kid's diet these days -- or so it seems when strolling through a Target (NYSE: TGT) store these days.

The eclectic soft drinks, sold in packs of four 8-ounce cans, are limited-edition Halloween flavors by Jones Soda (Nasdaq: JSDA). The odd pop is actually pretty tame by Jones' seasonal standards. Thanksgiving breeds the strangest of all concoctions from Jones -- Turkey and Gravy Soda.

The Halloween cans are an exclusive deal with Target. It follows the more conventional canned soda deal with Target that finds 12-ounce cans of flavors like cream soda or berry lemonade. Still, most sippers don't associate Jones with cans. It's the company's glass bottles with user-submitted photographs on the labels that generate most of the company's retail reach.

Jones' colorful bottled sodas can be found at select supermarket chains, as well as at your local Starbucks (Nasdaq: SBUX), Barnes & Noble (NYSE: BKS), or Panera Bread Company (Nasdaq: PNRA) location. It's a pretty impressive span for a tiny Canadian company out to compete against pop stars like Motley Fool Inside Value pick Coke (NYSE: KO) and Pepsi (NYSE: PEP).

Then again, it's that alternative beverage positioning and its offbeat flavors like Blue Bubblegum that have allowed the company to grow in the shadows. Last year, Jones Soda's profits tripled to $0.06 a share on a 37% spike in sales. Things haven't gone as well this year, with sales growing by just 20% and the company posting a $0.01-per-share deficit through the end of June.

That likely explains the wild ride that Jones Soda has provided for its investors. When I first wrote about the company back in March, shares could have been had for just $4 apiece. By early June, the stock had nearly doubled. It has since fallen back to roughly $5.

The prospects are promising as Jones Soda expands into energy drinks, juices, and even frozen pops. With its relationship with Target expanding (thanks to the new Halloween lines) and chains like Starbucks and Panera continuing to grow, Jones Soda should have little problem growing the top line. Getting margins back in line so that the company could continue to build on last year's profitability has posed the more serious challenge.


The variety and limited-time availability of holiday editions generates consumer excitement. JSDA getting its products in other top-notch retailers like Panera Bread is attractive. I'm excited enough to want to schlep to the Brooklyn Target to pick up the holiday pack. Especially for the turkey soda.